by Matt Carey
There has been a great deal of media coverage recently about the new autism prevalence estimate released by the CDC. The CDC provides a good summary page on prevalence data as well as the full report. If those who may see the report as a bit long, here is a bit of a summary of the findings.
The United States Centers for Disease Control (CDC) releases autism prevalence estimates as part of their MMWR (Morbidity and Mortality Weekly Report). They also maintain a page of information on autism. Today the CDC released the latest MMWR on autism: Prevalence of Autism Spectrum Disorders — Autism and Developmental Disabilities Monitoring Network, 14 Sites, United States, 2008. The one number from it that will be quoted most often is “1 in 88”, the new prevalence estimate.
The researchers working for the CDC use existing records: school, medical or both. So, in one area they may use school records. In another they may use school and medical records. What they don’t do is actually screen individual children and give them tests like the ADOS. This means that if a kid is not flagged somewhere in the records, they won’t find him/her. On the other hand, they don’t just count which kids already have autism diagnoses. They review the records and evaluate them to determine which kids are autistic or not. They cross check, meaning that for some fraction of the kids they use more than one person to check the records and they see how well the various researchers agree.
The CDC works with groups in a subset of states in the U.S.. For this report they used Alabama, Arizona, Arkansas, Colorado, Florida, Maryland, Missouri, New Jersey, North Carolina, Pennsylvania, South Carolina, Utah, West Virginia, and Wisconsin, most of which were used in previous reports.
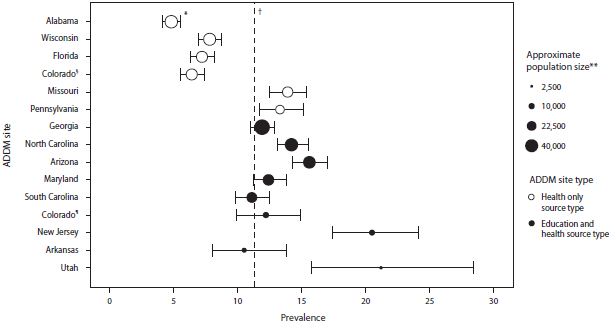
Overall, the prevalence was 1 in 88 (11.3 per 1,000). This continues the upward trend in prevalence estimates from the CDC. This figure (here for bigger) is from the CDC:

This varied a great deal state-to-state. Alabama had the lowest estimated prevalence at 4.1 per 1,000. Utah the highest at 21.2 per 1,000. Or, there is about a five fold variation in autism prevalence estimates, state-to-state.
Prevalence estimates also varied by race/ethnicity. The report states “the estimated prevalence among non-Hispanic white children (12.0 per 1,000) was significantly greater than that among non-Hispanic black children (10.2 per 1,000) and Hispanic children (7.9 per 1,000). ” The estimate for Hispanic in Alabama was 1.4 per 1,000 and for whites in Utah as 40 per 1,000. More than a 20 fold difference.
This figure (click to enlarge)was interesting in showing two things. First in showing the state-to-state variability in prevalence estimates. The second interesting point to me is the difference between sites with just medical records and those with medical and education records. The sites with health-only records have lower prevalence estimates. i.e. more kids are picked up by their school records.

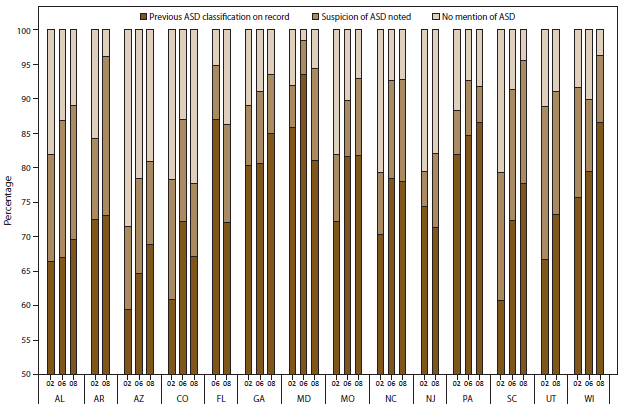
As with previous CDC reports, a large fraction of the children identified were not classified as autistic previously. This figure (click to enlarge) shows state-by-state and year-by-year what percent were previously unidentified. The figure also shows how many were previously unidentified but where a suspicion of autism was noted. In 2002, as many as 40% in some states were not classified as autistic before their records were reviewed. In general, over time the fraction previously unidentified has gone down. This would be consistent with schools and medical personnel getting better over time with identification of autism.

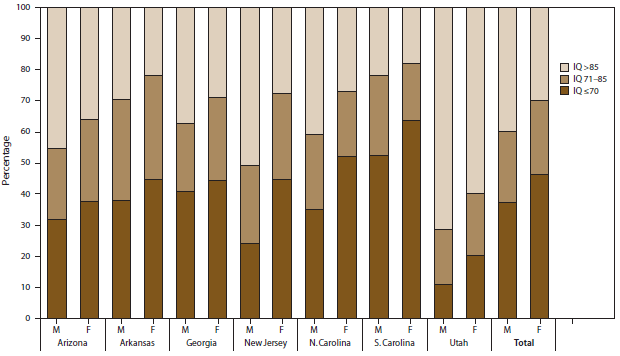
Many children identified had IQ test scores (or examiner statements) showing “normal” or borderline-normal values. This figure (click to enlarge) shows the percentages in many states with IQ>85, IQ=71–85 and IQ<70 (for children where the IQ data were available).

In Utah, for an extreme example, over 70% of those identified as autistic have IQ scores above 85. The CDC report reads:
When data from these seven sites were combined, 38% of children with ASDs were classified in the range of intellectual disability (i.e., IQ >70 or an examiner’s statement of intellectual disability), 24% in the borderline range (IQ 71–85), and 38% had IQ scores >85 or an examiner’s statement of average or above-average intellectual ability.
I.e. most children were borderline or above. Of course, the other way to read this is most children were borderline or below. Intellectual Disability is roughly defined as IQ below 70, so most children (about 62%) identified as autistic in this report were not intellectually disabled. States with higher prevalence estimates had higher percentages of non-intellectually disabled children.
The prevalence estimates are going up with time.
While ASD prevalence estimates in the overall population increased 23% for the 2-year period 2006–2008, and 78% during the 6-year period 2002–2008, the largest increases over time were noted among Hispanic children and non-Hispanic black children and among children without co-occurring intellectual disability. Better identification in these specific groups explains only part of the overall increase, however, as estimated ASD prevalence increased in all groups when data were stratified by sex, race/ethnicity, and intellectual ability.
The CDC report does have some limitations, and they note two primary limitations:
First, increases in awareness and access to services have improved the ability of the ADDM Network to identify children with ASD over time, and this likely contributes to the increase in estimated prevalence. The proportion of the increase that is attributable to such changes in case ascertainment or attributable to a true increase in prevalence of ASD symptoms cannot be determined. Ongoing monitoring is an important tool to learn why more children are being identified with ASDs and can provide important clues in the search for risk factors.
This study can’t say if there is an increase in the number of autistic children, or if there is, what would be the cause.
Also,
Second, the surveillance areas were not selected to be representative of the United States as a whole, nor were they selected to be representative of the states in which they are located. Limitations regarding population size, surveillance areas, and the consistency of these attributes were considered when analysts evaluated comparisons across multiple time points.
So, these numbers may not represent the United States as a whole.
It is valid to say that while these factors limit the ability of the CDC to define a true autism rate for the United States, the factors that go into these limitations are valid research concerns in themselves. It is very much worthwhile and valuable to ask why there are such variations state-to-state, for example. Answering this could lead to better identification and service provision overall. Likewise, understanding the effects of rising awareness could feed back into more efficient awareness campaigns to, again, help in identifying more autistic children and providing support and services to them.
The CDC concludes:
ASDs continue to be an important public health concern. The findings provided in this report confirm that prevalence estimates of ASD continue to increase in the majority of ADDM Network communities, and ongoing public health surveillance is needed to quantify and understand these changes over time. Further work is needed to evaluate multiple factors affecting ASD prevalence over time. ADDM Network investigators continue to explore these factors in multiple ways, with a focus on understanding disparities in the identification of ASDs among certain subgroups and evaluating temporal changes in the prevalence of ASDs. CDC also is engaged with other federal, state, and private partners in a coordinated response to identify risk factors for ASDs and meet the needs of persons with ASDs and their families. Additional information is available at http://www.cdc.gov/autism.
We need these data. Limitations and all. We need to know what the autism prevalence is, what the makeup is of the autistic population, and where we can do better identifying autisics. Most countries have no autism prevalence information. Other countries have few or even just one study. In my opinion we are fortunate to have the CDC and other researchers focusing on these questions here in the United States.

 We are delighted to announce the recipients of the
